Image

Carlyn Johnson and Richard D. Bowden, Ph.D.
Allegheny College, Center for Environmental and Economic Development
Excerpted from Allegheny College, Center for Environmental and Economic Development
Publication CEED-2010-2: Potential for Wind Power at Acutec Precision Machining, Inc., Saegertown, PA.
Image

|
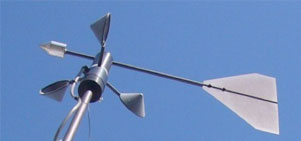
| Figure 1. Installing anemometers on the cell tower at Acutec. Photo by Bill Owen. |
Background:
Acutec Precision Machining, Inc. in Saegertown, Pennsylvania uses a large amount of electricity in its machining operations, and anticipates increased expenditures for electricity use with upcoming deregulation of electrical power generation. With its operation sited atop a windy ridge, the firm is interested in determining if there is sufficient wind to power a commercial wind turbine that could satisfy the firm's annual electrical needs. According to the National Renewable Energy Laboratory wind resource map for Pennsylvania, annual average wind speeds in Saegertown at the location of Acutec are approximately 4.0 m/s to 5.5 m/s (8.9 mph to 12.3 mph) at a height of 80m (262 ft) above ground level. These wind speeds are within the range generally considered to be sufficient for wind turbine placement, but the data were modeled and were not obtained by direct measurement. Because of the large capital investment required for wind turbines, it is critical to measure wind speeds directly at a proposed location. Thus, the purpose of this study is to measure actual wind speed and direction at the location of Acutec Precision Machining, Inc.
Methods
Acutec's Saegertown facility sits on a ridge at an elevation of approximately 1,100 feet in Saegertown, PA. In 2007, on a commercial cell tower located at the site, anemometers were installed at heights of 50, 110, 170, and 230 feet above ground level to develop a vertical wind shear model to assess wind turbine designs that operate at different heights (Figure 1). The anemometers also measured wind gust and wind direction. Onset S-WCA-M003 model anemometers (Figure 2) were attached to 6 ft-(2m)-long extension arms that were affixed to the southwestern location of the cell tower and were programmed to record average wind speed, gust, and direction every minute. Approximately every one to three months, data were downloaded before being processed. Data from the wind sensors were stored on Onset's HOBO® Micro Station Data Loggers, model H21-002 and were uploaded to the data organization and analysis software, HOBOware®Pro. This software formatted the data to be compatible with our wind data analysis software, Windographer Version 1.47, provided by Mistaya Engineering Co., Calgary, Alberta, Canada.
Image
|
| Figure 2. Onset S-WCA-M003 wind sensor. The wind vane is 317 mm (12.5 in.) high x 419 mm (16.5 in.) wide. |
Results and Discussion
After 13 months of data collection (October 2008 to November 2009) the data were exported from Hoboware Pro to a text format. The rate of recovery of recordings was above 70% for all heights and above 80% for three of the four heights. Data for January and February 2009 at the 230 foot height were lost due to data collection failure.
Mean wind speeds were lowest in summer and highest in the winter, with a minimum in July (8.7 mph) at a height of 230 feet and a maximum in December (13.1 mph) at the same height (Figure 3). As expected, annual mean wind speed and maximum wind speed increased with height. We determined wind speed versus height (known as vertical wind shear). These data were then used to develop a predictive equation for wind speed based on height between 0 and 330 ft. This is useful because different wind turbine models have different hub heights. Wind speed varied over the day with speeds generally highest between 12:00 and 18:00, and lowest at night.
The data at 230 ft show the most promise in wind resource availability. Gusts were consistently about 2 mph greater than the mean wind speed. The seasonal wind speed profile shows that the highest mean wind speed (13.55 mph) was in December and the lowest speed (8.80 mph) was in July. The mean annual wind speed at this height was 10.66 mph.
The mean wind speed rose shows that the highest mean wind speeds, about 12.5 mph, came from the south and southeast. The total wind energy rose shows that most wind energy was derived from the southwest. Finally, the wind probability distribution shows that most often (about 9.5% of the time), the wind was within the 9 to 10 mph range. Wind speeds were 0 mph for about 3.4% of the time, and were less than 7 mph (the minimum wind speed required for most wind turbines to produce electricity) for less than 14% of the time.
Image

|
| Figure 3. Seasonal wind speed profile for 50, 110, 170, and 230 feet at the Acutec site. |
Conclusions and Recommendations
Our data suggest that the wind resource is sufficient to power a large commercial wind turbine that could meet Acutec's annual electrical needs. We used Windographer's output, with our wind data, to estimate the annual electrical output of a number of commercially available wind turbines (Table 1.) Based on Acutec's 2008 energy demand of 2,879,936 kWh, wind turbines capable of generating 1 MW to 3 MW per year are most suitable. Larger turbines produce more electricity, and a single large turbine can potentially satisfy Acutec's annual energy needs. Larger turbines are more expensive; however, economies of scale and building costs may suggest that a single turbine is more economical than multiple turbines. A full economic analysis must include capital and maintenance costs, federal and state incentives, tax credits, grants, loans and interest payments, and payback periods.
| Turbine Model | Turbine Size (MW) | Predicted Annual Power Output After Losses (kWh) | % of Acutec’s Annual Energy Demand |
| Vestas V82 | 1.65 | 1,988,913 | 69.0 |
| Vestas V90 | 2.0 | 2,320,593 | 80.6 |
| Vestas V90 | 3.0 | 2,555,543 | 88.7 |
| Sinovel SL3000/105 | 3.0 | 3,435,449 | 119.3 |
| Sinovel SL3000/115 | 3.0 | 4,112,003 | 142.8% |
Our results suggest that other locations in this region of northwestern Pennsylvania may be suitable for wind power generation. Looking at the rolling hill and valley topography of this area it is clear that there are other areas that have elevations and ridge and valley topographic characteristics similar to those at the Acutec site. Thus, even though the Pennsylvania wind map indicates that the area inland of Lake Erie has limited wind resource potential, it is obvious from our data, and from the topographic characteristics of the region, that there may be more potential for wind power than published estimates suggest.