Image


In controlled environments, a few Pascals can make the difference between containment and compromise. Whether you’re maintaining a positive‑pressure cleanroom (to keep contaminants out) or a negative‑pressure space (to keep hazards in), differential pressure (ΔP) is one of the most important signals your facility can capture—especially during door events, filter loading, and HVAC control changes.
The challenge is that many facilities still rely on spot checks or local gauges. Those tools show what’s happening right now, but they don’t create the historical record you need for investigations, trend analysis, and audit support. That’s where continuous data logging pays off.
Differential pressure monitoring helps teams answer three high‑stakes questions:
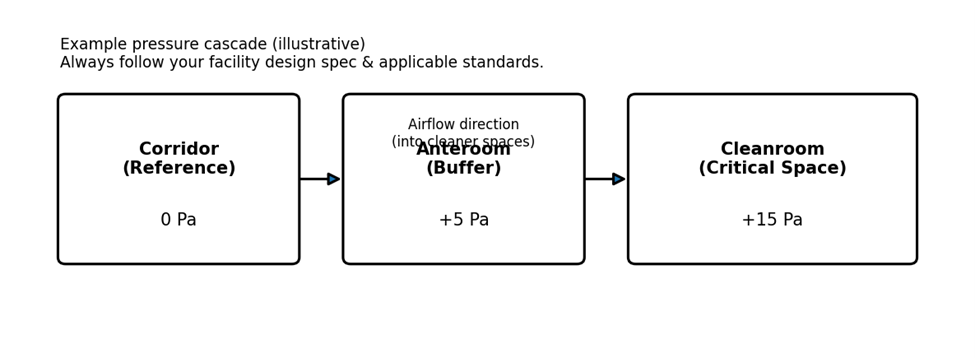
Because ΔP setpoints and acceptable limits vary by application, always follow your facility design specifications and any standards or protocols that apply to your operation.
A practical ΔP monitoring plan usually includes measurements at these boundaries:
When you log ΔP at a tight interval (e.g., capturing short door events), trends often point to common root causes:
List the rooms that must be positive or negative relative to adjacent spaces, and identify the boundaries that matter most.
Use a differential pressure transducer with an analog‑input HOBO data logger so you can record ΔP alongside other conditions if needed.
Door events happen quickly. Faster logging captures excursions that a 15‑minute trend can miss.
Use your SOP/design spec. Consider both magnitude (how far) and duration (how long).
Use cloud tools like the HOBO MX Gateway for continuous monitoring and automated alarm notifications and LI-COR Cloud analysis software to review for weekly trends.
Using a data logger like the HOBO MX1105 4-Channel Data Logger allows you to simultaneously track other environmental conditions, energy use, and other factors.
Once you have continuous ΔP data, compliance reporting for regulations like ISO 14644 and GMP— becomes simpler. Many teams track:
Below are common building blocks for a cleanroom/containment ΔP logging system. Selection depends on your required ranges, sensor outputs, and whether you need local or cloud‑connected access. Need help selecting a sensor range, wiring, or a deployment approach? Our application specialists can help you build a monitoring configuration that matches your space and compliance needs.
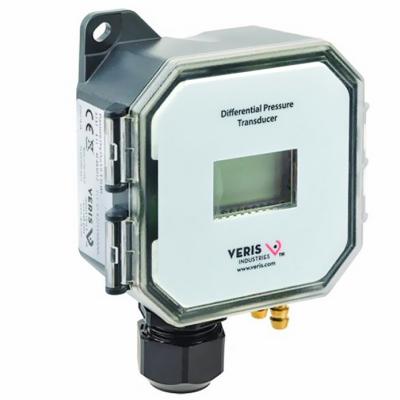
A field‑selectable transducer that measures differential air pressure (and can switch to air velocity mode). Useful for room‑to‑room ΔP monitoring and airflow diagnostics.
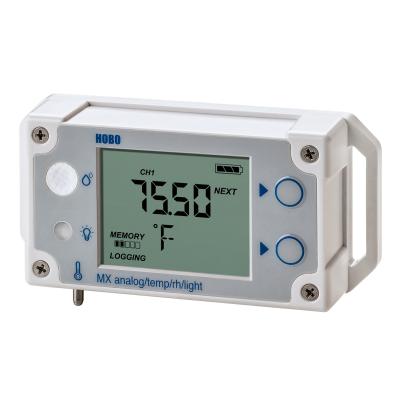
Logs an external analog sensor (such as ΔP) while also capturing temperature and RH—helpful for correlating pressure events with HVAC conditions. Bluetooth setup and readout via the HOBOconnect app.

A flexible option when you want multiple analog channels (e.g., ΔP at multiple boundaries, or ΔP plus airflow/other transmitters). Bluetooth setup and readout via HOBOconnect.
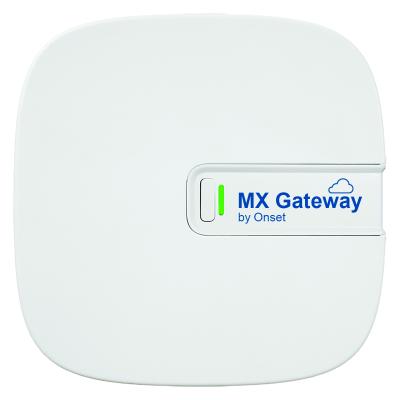
Automatically transfers data from compatible HOBO MX loggers to the cloud (with an MX Data Plan), enabling remote visibility and alarm notifications.