Image

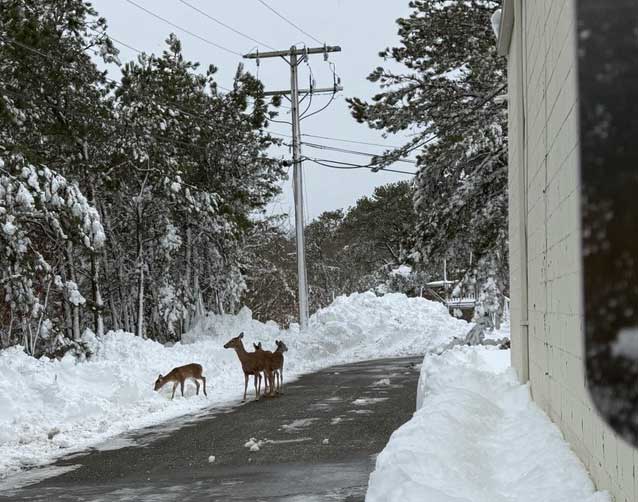
Monday, February 23rd wasn’t just a snow day—the Blizzard of 2026 was a reminder that winter still has teeth in southern New England. The combination of heavy snow, extreme wind, and widespread outages hit the South Shore, Cape Cod, and southeastern Massachusetts particularly hard.
For communities and facilities, storms like this raise the same question every time: What did we know, when did we know it, and what could we prove afterward? That’s where monitoring matters. A storm turns into a dataset—if you’re measuring the right things.
A few headline weather stats from post‑storm reporting:
Sources
A blizzard isn’t defined by snowfall totals alone. The National Weather Service's definition hinges on wind and visibility:
When weather goes sideways, the most useful datasets are the ones that connect the atmosphere to real impacts: power, flooding, and building performance.
High winds drive outages, drifting, coastal impacts, and structural stress. A site‑specific wind sensor can validate what your facility actually experienced (not just what the nearest airport reported).
Track freeze risk, freeze–thaw cycles, and building envelope performance—especially in unoccupied spaces, pump rooms, and crawlspaces
Pressure trends help characterize storm intensity and timing; they’re also a valuable reference for water level compensation when you’re measuring stage or surge.
Even in a snowstorm, precipitation data supports runoff modeling and helps interpret rising water levels after melt or rain changeovers.
Pairing water level data with timing, pressure, and wind gives you a clearer picture of why a site flooded—and how quickly it rose.
If you manage critical facilities, monitoring indoor temperatures during power loss can help prioritize response and document conditions for insurers or stakeholders.
After a major storm, data is useful for more than just identifying “what happened?” It helps you learn from the event to make practical improvements:
For storm monitoring, the goal is simple: get reliable measurements, minimize site visits during hazardous conditions, and make it easy to share data afterward.
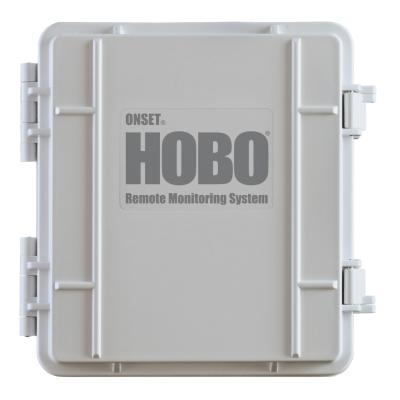
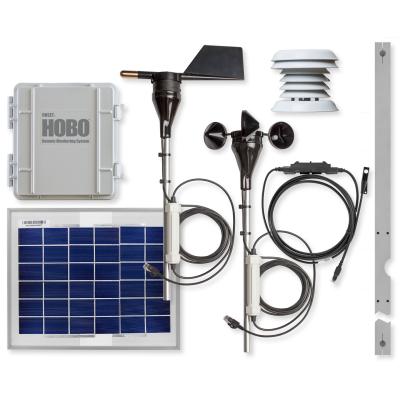
Weather station that enables remote monitoring
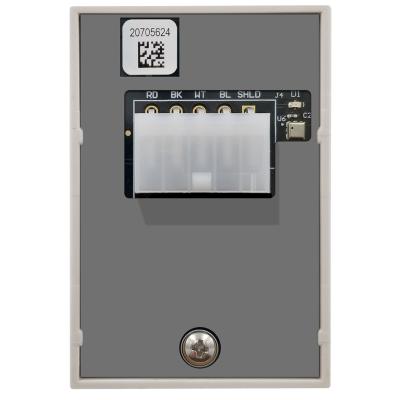
Module that connects water level sensor to remote station
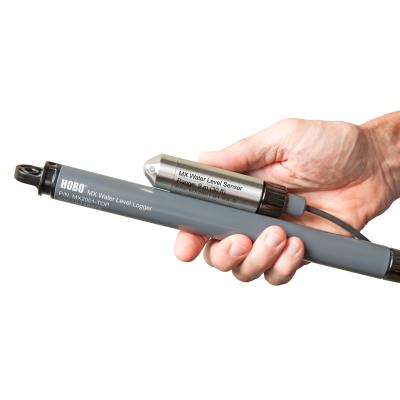
Water Level data logger with Bluetooth wireless data offload