Image


Using powerful data processing tools, automated storage, and workflows, Aquarius produces a highly defensible suite of continuous and discrete water data to support water resource management decisions. Water monitoring agencies worldwide trust Aquarius for its real time water information and QA/QC capabilities that provide a rich audit trail.

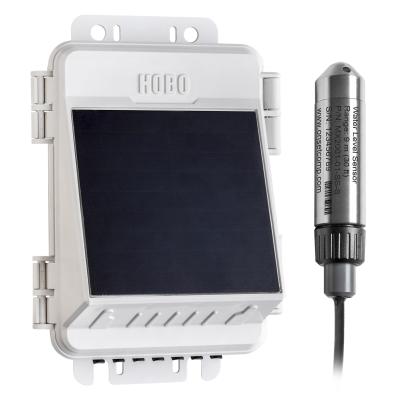
Adding a HOBO connected weather station allows you to log water data on a near real-time basis without a site visit.

HOBO sensors and weather stations send data directly to the Aquarius cloud-based platform for robust data processing and analysis.

HOBO's range of sensors lets you add and monitor additional environmental parameters such as temperature, rainfall, and soil moisture.

AQUARIUS streamlines the management of continuous and discrete water data with powerful data processing tools and automated storage, processing, and workflows yielding defensible data.

AQUARIUS also transforms data into information by adding historical and meaningful context that provides actionable insights.
After purchasing your HOBO RX station and Aquarius, you can easily set up an automated data delivery:


Yes! Following HOBOlink's step-by-step instructions carefully, it's not hard to set up a data feed to AQUARIUS. You will need to use AQUARIUS Connect and have access to an ftp site. The basic flow of the data is:
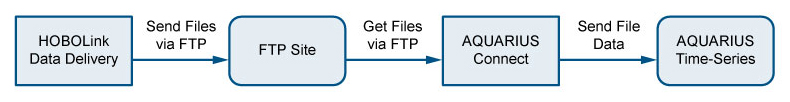
For detailed instructions, see “Setting up an AQUARIUS Date Feed” on page 71 of the HOBOlink User’s Guide
Contact Aquatic Informatics, the creator of AQUARIUS:
2400 - 1111 West Georgia St.
Vancouver, BC V6E 4M3
1.877.546.5699 | +1.604.873.2782
AQUARIUS provides powerful and easy-to-use tools for creating stage-discharge curves for your sites. Once you have a curve created for your site, you can enter points from that curve into a HOBOlink Stage-Discharge Table, that will be used to create a water flow data channel from incoming water level data. The resulting water flow data can be used be used for alarm notifications, shown in graphs or exported. HOBOlink allows entering up to 20 points in a stage-discharge table. HOBOlink uses linear lines between these points to calculate the discharge values between points entered. For the best accuracy, you will want to enter the most points for areas of the curve where the slope is changing the most.

